Author: Mark Seaman
With Power BI/Fabric moving more towards self-service analytics, you may realize that different teams or individuals can get different answers to the same questions. Many users may be familiar with Power BI, but they may lack expertise in creating measures, understanding the data outside of Power BI, and knowing the business rules. This is most important at the enterprise level, where multiple teams may be creating reports for leadership and answering similar questions but have come up with different answers due to their team’s business rules.
In the example below, I’ll show examples of how teams can come up with different answers to the same question. We’ll be using randomly generated healthcare data by Synthea. We’re mostly going to investigate the “Claims” part of the data. For example, a claim is how much someone paid out of pocket for coming into the hospital.
Example:
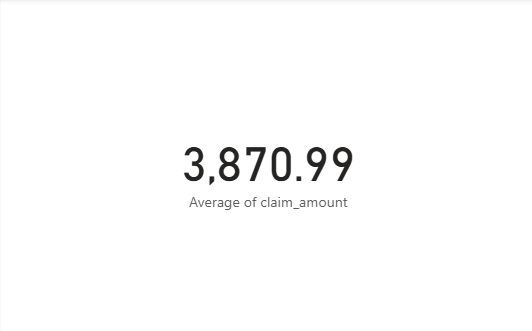
Leadership wants to know what the average claim cost is for the hospital group’s patients. They have multiple teams add “Average Claim” to their monthly report for leadership, but each team is coming up with different answers.
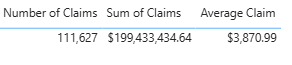
- Team A: $3,870.99
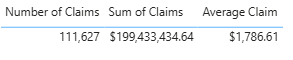
- Team B: $1,786.61
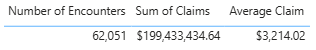
- Team C: $3,214.02
Of course, leadership is wondering why these teams are getting all these different numbers. Leadership asks the teams how they are calculating the average claim cost.
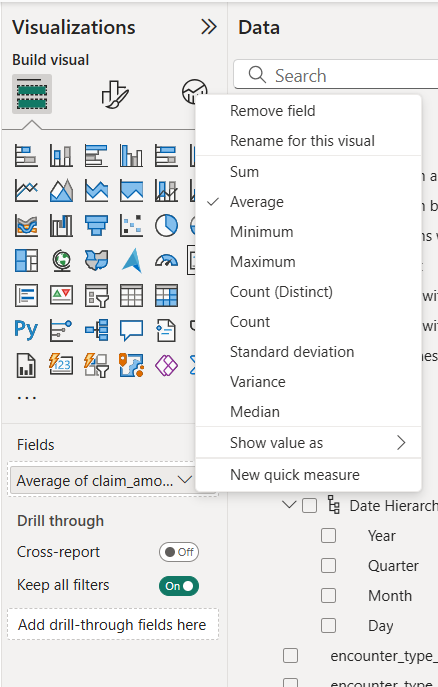
Team B: They were going to be using the standard Average function, but they were also looking at the total number of claims and the sum. They realized that the numbers weren’t adding up.
They ended up doing research into the data to see why this was happening and found that if the patient didn’t have to pay out of pocket, the “Claim Amount” in the table was NULL. A NULL value does not get included in the standard Average calculation. They created a measure that was Sum of Claims/Number of Claims.
Team C: Is looking into encounters, and they are seeing what the average claim is for each encounter. They created a measure that was Sum of Claims/ Number of Encounters. Yet, they are still calling it “Average Claim.”
In context, all these options can be true, but we need to have a standardized way of showing these important metrics across an enterprise. The best way to do this is to create a semantic model that is labelled Certified or Master Data.
Solution
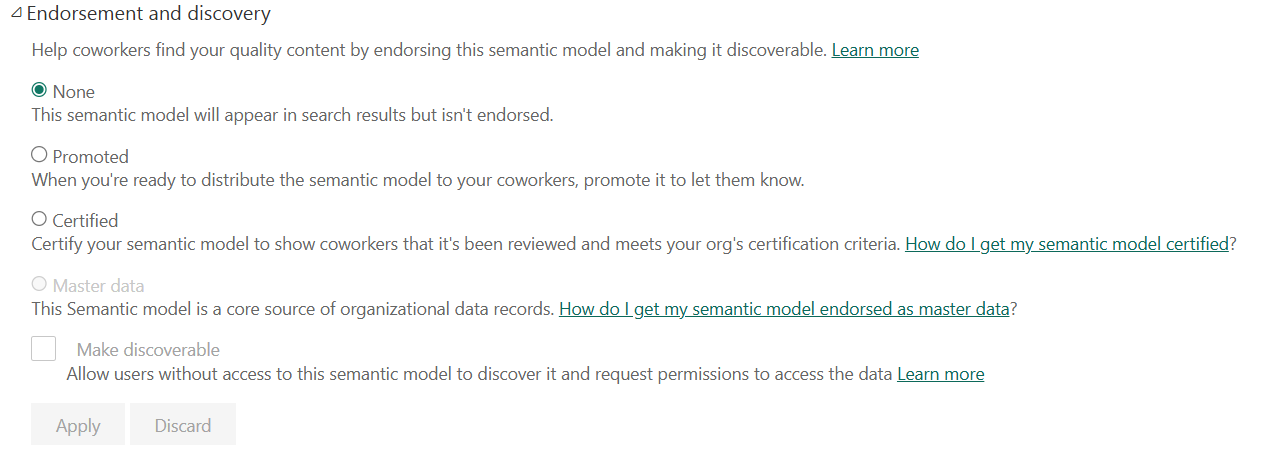
What is a Certified or Master Data semantic model?
- Certified: “Certify your semantic model to show coworkers that it’s been reviewed and meets your organization’s certification criteria.”
- Master Data: “This semantic model is a core source of organizational data records.”
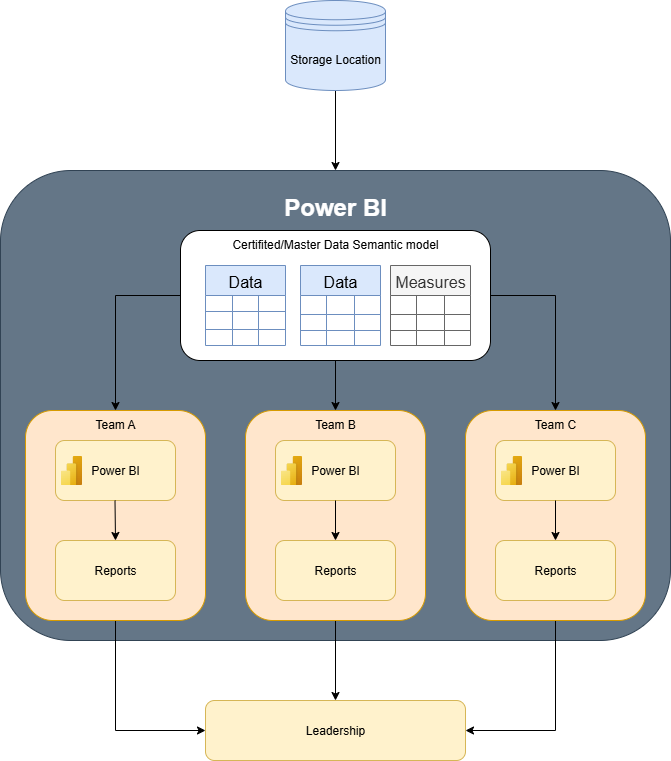
The visual below shows how to create both a Certified or Master Data semantic model
Why use Certified or Master Data?
This allows for a single source of truth for all the reports that are using that model. If measures or business rules are changed the change is added in the semantic model, all the reports connected to the semantic model will automatically update to the correct measure.
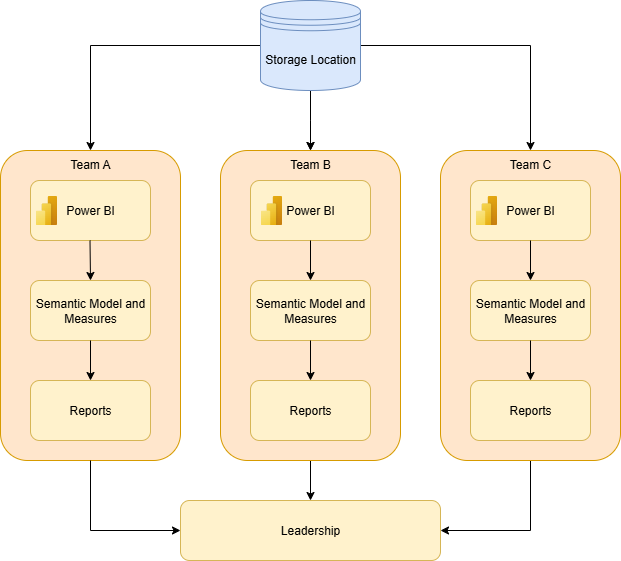
Before: Each team would pull the data from their sources, create the semantic model and measures, then produce the report.
After: A developer would create the certified semantic model that has been reviewed and approved by all the teams. Each team would then connect to the Certified semantic model and produce the reports. This allows for less work across the teams and consistency with the data.
Conclusion
This scenario highlights the critical need for a single source of truth in enterprise-level analytics. By establishing a certified or master data semantic model, organizations can eliminate the confusion and inconsistencies that arise from different teams using their own unique business rules and calculations. This approach not only provides leadership with reliable, consistent data, but also streamlines the reporting process, saving time and effort for everyone involved.