Expert Data Analytics Consulting for Financial Companies
Optimize Your Financial Company’s Data Analytics
Your financial institution likely has a large amount of data to sift through and analyze. Our company has worked with a variety of businesses in the financial industry to assist with collecting and organizing their data to generate important and valuable insights. Our work has included assisting companies in extracting data from disparate systems such as SAP, Oracle, IBM TM1, Dynamics 365, and more.

- Tracking financial indicators and ensuring that business units are meeting their goals
- Confirming that the business complies with regulations
- Visualizing the overall health of the organization
- Improving business operations related to customer service and satisfaction
Do you need help maximizing data analytics for your financial organization? Contact us today!
What a Great Financial Analytics Solution Can Do
Our team can create a solution for you that will help you maximize your analytics investment and initiatives. The solution could be a lakehouse architecture in Azure or a customary data warehouse that is located on-premise. With the solution we deliver, you will easily be able to do the following:
- Comply with federal compliance and adhere to Sarbanes-Oxley
- Generate accurate financial statements including but not limited to balance sheets, income statements, and statements regarding mergers, acquisitions, and divestitures
- Create dashboards, key performance indicators (KPIs), and performance measures that can be utilized across departments to improve business processes and measure company effectiveness
- Plan budget requirements for projects and initiatives
- Drive departments to better forecast sales, margins, profitability, and more
- Consolidate reporting to reduce redundant and/or inaccurate reports
Ready to maximize your analytics? Contact us today.
Leverage our financial analytics consulting services to get the most out of the technology.
Our Latest Blog Content
Creating Folders in Power BI Workspaces
Creating folders in Power BI is a new capability recently announced by Microsoft. In this blog, we explore the benefits of Power BI folders and how to create them.
Exploring Our End-to-End Custom Azure Solution – Part 2
Here’s Part 2 of our series on our custom end-to-end Azure solution. Our solution involves various Azure products, Power BI, and more.
Understanding Power BI Filters, Slicers, & Highlighting
We explore three highly useful Power BI features that enhance data analysis: highlighting, filtering, and slicing.
How to Connect Power BI to Serverless Azure Synapse Analytics
Here’s a solution we created for accessing Azure Data Lake Storage Gen 2 data from Power BI using Azure Synapse Analytics.
How to Use Azure AI Language for Sentiment Analysis
Learn about sentiment analysis in Azure, including how to leverage Azure AI Language services to conduct it.
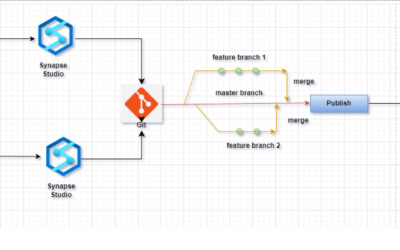
GitHub Source Control Integration with Azure Synapse Workspace
GitHub source control integration with Azure Synapse workspace allows data professionals to manage scripts, notebooks, and pipelines in a version-controlled environment.

Key2 Consulting | [email protected] | (678) 835-8539
