By: Mason Prewett
When creating a Power BI report, the number of measures can add up and become difficult to organize and manage. Having measures in a table with other fields can become confusing. A measure table can help, but this too begins to get cluttered. Fortunately, a good solution is to group Power BI measures.
In this article, I demonstrate how to transform a table of unorganized measures into a table of grouped measures. Let’s dive in.
Example – Group Power BI Measures
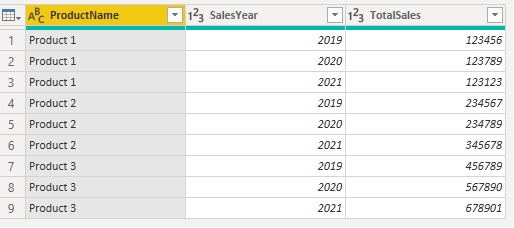
I will be using the following example dataset created from simply entering the data manually in Power BI Desktop. A “total sales” and “average sales” measure will be created for each product to demonstrate how to organize these in groups.
Note: This article focuses on measures, but this strategy applies to fields as well. Anything demonstrated in this article can also be applied to fields.
1. Create a Measures Table
Creating a separate table for only measures makes managing these much easier. It is not necessary in a measures table to sift through fields and measures – there is a table designated specifically for this.
Instructions
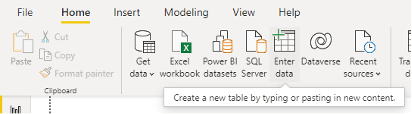
From the home tab, click Enter Data.
Give the measures table a name, this example used the name “Measures_Sales”. Click Load.
Pro Tip: As of writing this article, simply naming the table “Measures” will result in the table being named “Measures(2)”. This is due to Power BI Desktop reserving the name “Measures” for internal application purposes.
As shown in the image below on the left-hand side of the image, this creates a normal table with one column in it. The next step is to create the first measure.
After creating a “total sales” measure for Product 1 in the measures table and then deleting Column1, the measures table now transforms to look like the image on the right.
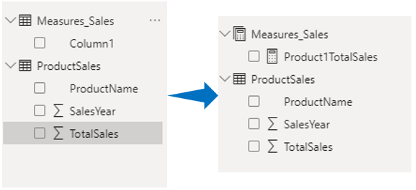
Notice that the icon for the measures table has changed to indicate it contains only measures. A mix of fields and measures will result in the table icon, the same shown for ProductSales.
2. Group Power BI Measures
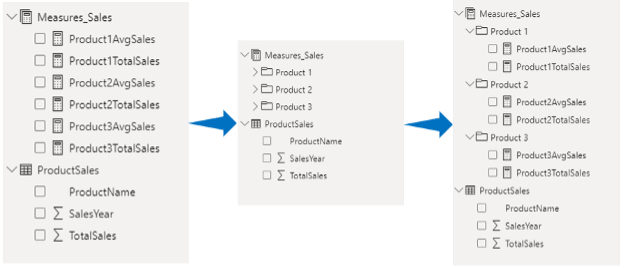
After creating a “total sales” and “average sales” measure for each product, the measures table now looks like this:
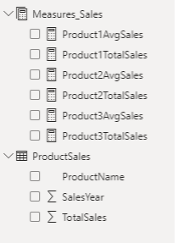
This is the problem that this article is trying to solve. This is a table with six measures that are similarly named. It is easy to see how measures can become hard to find when there are more of them and especially if they are not using the same naming convention.
The next step is to group these measures.
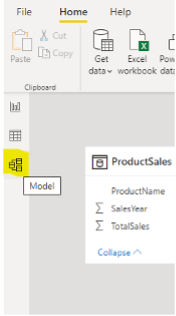
In Power BI Desktop, click on the Model tab on the left sidebar as shown in the image below.
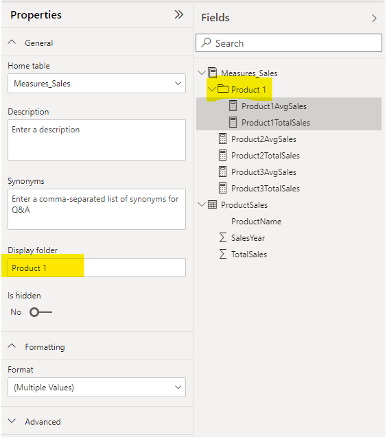
On the right of the model screen, there will be a section labeled Properties and a section labeled Fields.
In the Fields section, expand the measures table and highlight the measures that need to be grouped first by holding ctrl and clicking each.
Under the Properties section, in the Display folder text box, enter the name of the group. This will be shown in folder format after clicking enter. See the image below for an example of this configuration.
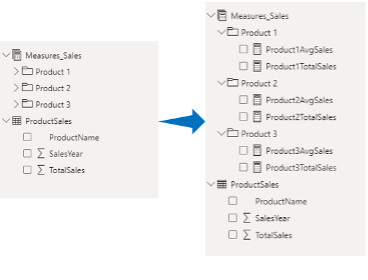
Continue to set up groups using this strategy until the measures are organized in the desired format. The end result will be an expandable list of measures in the measures table (see image below).
To edit these groupings, simply go back to the model section and highlight the measures to be edited. From here they can be renamed, or make the text box blank to remove the grouping.
Thanks for Reading! Questions?
Thanks for reading! We hope you found this blog post useful. Feel free to let us know if you have any questions about this article by simply leaving a comment below. We will reply as quickly as we can.
Keep Your Data Analytics Knowledge Sharp
Get fresh Key2 content and more delivered right to your inbox!
About Us
Key2 Consulting is a boutique data analytics consultancy that helps business leaders make better business decisions. We are a Microsoft Gold-Certified Partner and are located in Atlanta, Georgia. Learn more here.