• Data Platforms
    • Databricks
    • Microsoft Azure
    • Microsoft Fabric
    • Power BI
    • SQL Server
  • Data Engineering
    • Azure Databricks
    • Azure Data Factory
    • Azure Data Lake
    • Azure SQL DB
    • Azure Synapse Analytics
    • SQL Server Analysis Services
    • SQL Server Integration Services
    • SQL Server Reporting Services
  • Company
    • Microsoft Fabric Workshop
    • About
    • Blog
    • Careers
    • Industries
      • Finance
      • Healthcare
      • Manufacturing
      • Pharmaceutical
      • Retail
      • Public Sector
    • Our Team
    • Resources
      • Azure Resources
      • Case Studies
      • Power BI Demo
      • Power BI Resources
      • SSIS eBook
  • Contact Us
3 Power BI Map Visuals to Bring Your Data to Life

3 Power BI Map Visuals to Bring Your Data to Life

Jan 14, 2020 | Data Visualization, Microsoft, Microsoft Power BI

By: Matt Wollner     Microsoft Power BI has many great features, two of which are “Bubble Map” and “Filled Map”. Both of these features are map visuals that are easy to set up and have high utility for all users. They are powered by Bing Maps and location...
Create A File System Size Tree View Using PowerShell

Create A File System Size Tree View Using PowerShell

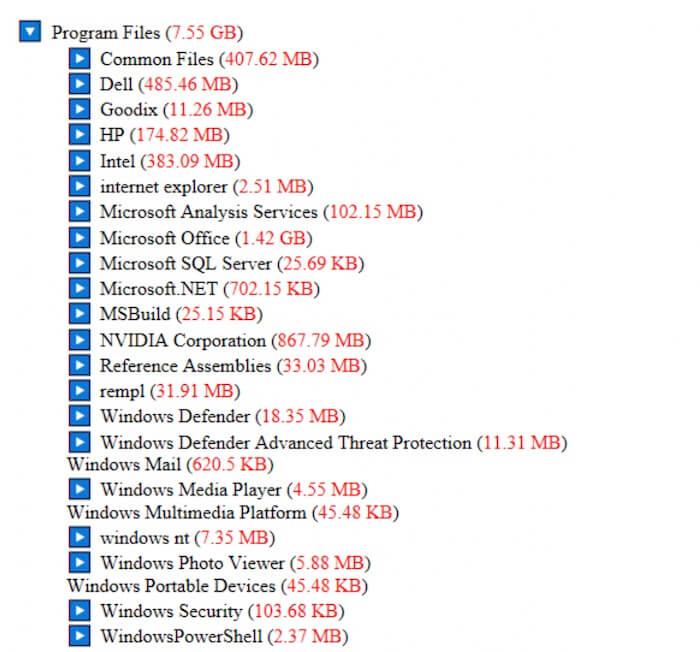
Apr 10, 2019 | Business Intelligence, Data Visualization, PowerShell, Tech Tips, Technical Information

By: Mason Prewett   Introduction As an admin of many server types, I often encounter the issue of a machine running out of disk space. Tracking the culprit folder that was hogging up disk space used to be a troublesome, manual effort. However, I recently coded a...
Location, Location, Location…  Adding richness to your data using Spatial Data Types in SQL Server

Location, Location, Location… Adding richness to your data using Spatial Data Types in SQL Server

Mar 15, 2019 | Business Intelligence, Data Visualization, SQL Server, Tech Tips, Technical Information

By: Andy Kim   Introduction If you ask a SQL professional to name some data types, you might hear: varchar, int, datetime, decimal, or something to that effect. Rarely do people mention the spatial data types of: geography and geometry. This is because most SQL...
How to Use Power BI Bookmarks

How to Use Power BI Bookmarks

Feb 7, 2019 | Business Intelligence, Data Visualization, Microsoft, Microsoft Power BI, Tech Tips

By: Matt Wollner     Power BI Desktop has been on a roll with monthly updates making it easier for users to get insight out of their data. Drag and drop visualizations are making it easier than ever to craft simple, complete dashboards. The highlighting...
How To Build and Analyze a Survey with PowerBI

How To Build and Analyze a Survey with PowerBI

Jan 22, 2019 | Business Intelligence, Data Visualization, Microsoft, Microsoft Power BI, Tech Tips, Technical Information

By: Mike Pierre-Louis      Introduction With another year in the rearview, now is the time when companies will be reaching out to their clients and/or users to ask for feedback. Everyone knows that manually reading survey responses is so 2018 (ok, kidding,...
Custom Visuals with Microsoft’s Power BI

Custom Visuals with Microsoft’s Power BI

Dec 12, 2018 | Business Intelligence, Custom Development, Data Visualization, Microsoft, Microsoft Power BI, PowerShell

By: Phillip Sharpless     Introduction Microsoft’s Power BI provides a robust set of built-in visuals for displaying data in your reports and dashboards. However, no matter how many visuals are built in (or how flexible they may be) there may come a time...
« Older Entries

Recent Posts

  • Key2 Consulting Partners With Databricks To Help Companies Maximize Data and AI
  • How to Build Metadata-Driven Pipelines in Microsoft Fabric
  • Getting Started With Copilot in Microsoft Fabric

Categories

  • .NET
  • Amazon
  • Amazon MWS
  • Amazon QuickSight
  • App design
  • Application Development
  • Artificial Intelligence
  • Azure
  • Azure Cosmos DB
  • Azure Data Factory
  • Azure Databricks
  • Azure Synapse
  • Big Data
  • BIML
  • Business Intelligence
  • Careers
  • CCPA
  • Cloud Technology
  • Conferences
  • Consulting
  • COVID-19
  • Custom Development
  • Data Encryption
  • Data Governance
  • Data Management
  • Data Regulations
  • Data Security
  • Data Visualization
  • Data Warehousing
  • Databricks
  • Entrepreneurship
  • Fantasy Football
  • Featured
  • Featured
  • GDPR
  • GitHub
  • healthcare
  • Key2 Stories
  • Machine Learning
  • Microsoft
  • Microsoft Copilot
  • Microsoft Excel
  • Microsoft Fabric
  • Microsoft Power Automate
  • Microsoft Power BI
  • Microsoft PowerApps
  • Open Source
  • PowerShell
  • RevoScaleR
  • Salesforce
  • Self-Service BI
  • SharePoint
  • Snowflake
  • Software Development
  • SQL Server
  • SSIS
  • Tableau
  • Tales from Consulting
  • Tech Tips
  • Technical Information
  • Uncategorized
  • Web 3.0
  • Web Applications
  • Web design
  • Web Development
  • What's Happening at Key2
We use cookies to ensure that we give you the best experience on our website. If you continue to use this site, you consent to our use of cookies and the terms of our Privacy Policy.Got It!