Oct 9, 2018 | Azure, Business Intelligence, Conferences, Consulting, Data Visualization, Key2 Stories, Microsoft, Microsoft Power BI
By: Andy Kim Introduction It was a beautiful fall morning as I drove towards the Microsoft office in Alpharetta, GA. I was on my way to attend the annual 2018 SQL Saturday Atlanta – BI Edition. When I arrived, there was a nicely furnished office with great...

Oct 23, 2017 | Data Visualization, Featured, Microsoft, Microsoft Power BI, Technical Information
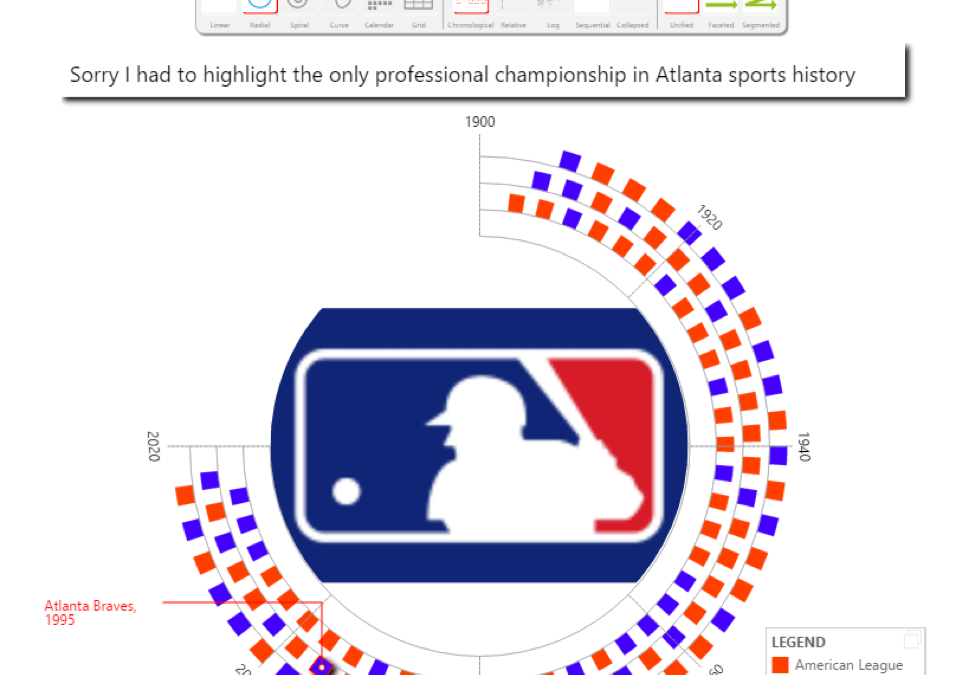
By: Ken Adams Sr. BI Consultant In this article, I am going to dive into Power BI and show you the new Timeline Storyteller visualization. This is a custom visualization for Power BI that can be found at the Office Store. I will later show you how to add it to...

Mar 14, 2017 | Business Intelligence, Data Visualization, Microsoft Power BI
By: Andy Kim Business Intelligence Consultant at Key2 Consulting If you haven’t read last week’s part 1 of this blog, you can find it here: Baby Steps: How to Create Basic Charts in Power BI Desktop. Great, you’ve created a report in...

Mar 9, 2017 | Data Visualization, Microsoft Power BI, Technical Information
By: Matt Wollner Sr. Business Intelligence Consultant at Key2 Consulting I’ve spent a lot of time talking to business owners and managers. And I’ve noticed that many of these leaders tend to use excel for their analytics needs. Furthermore,...


