By: Mason Prewett, Dean Jurecic, and Mark Seaman
Introduction
Azure Synapse Analytics (Synapse) is a powerful tool that makes connecting to data in Azure Data Lake Storage Gen2 (ADLS) as easy as traditional data sources like SQL Server. This article outlines the details of a solution that stages data in ADLS, and then uses Synapse serverless views to structure this data and serve it to a Power BI report.
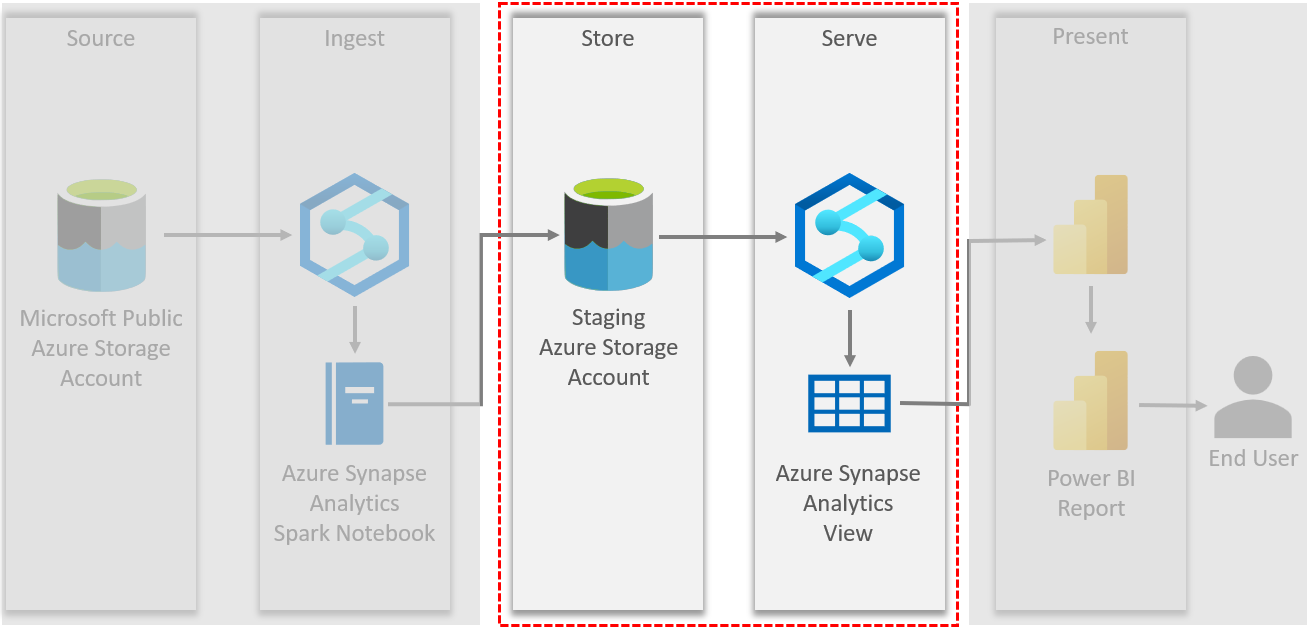
Below is a diagram that shows the details of our Synapse and Power BI solution.
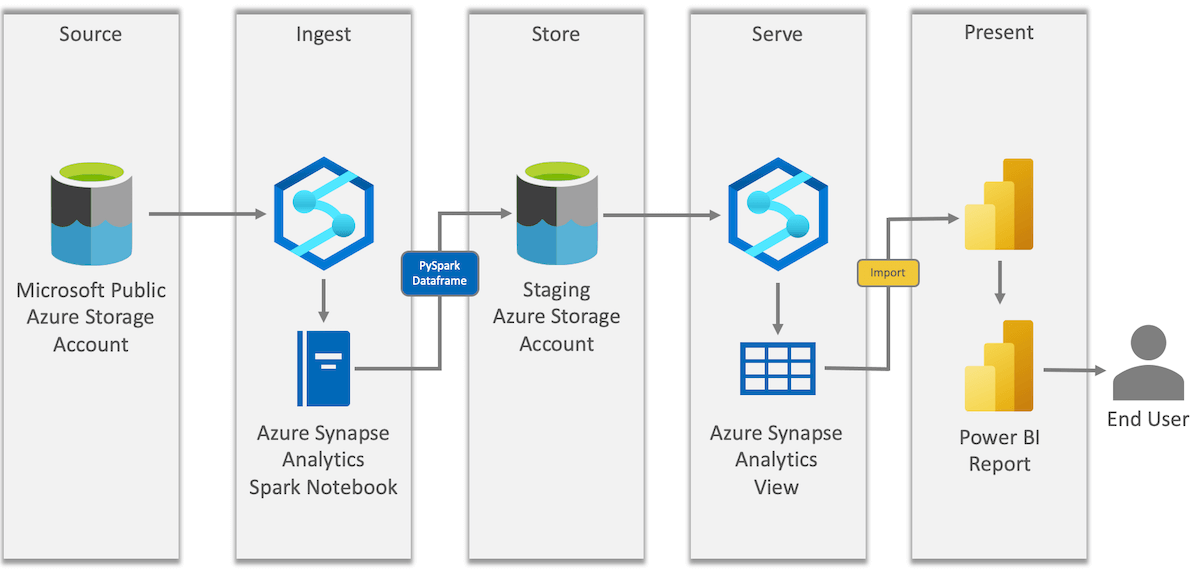
As shown above, Synapse is used to do the following two operations in this solution:
- Ingest data from ADLS and write it to a staging ADLS location
- Serve ADLS data to a Power BI Report
Synapse serverless views are used to virtualize ADLS data and make it easier to query and connect to with reporting tools.
Data Ingestion & Storage
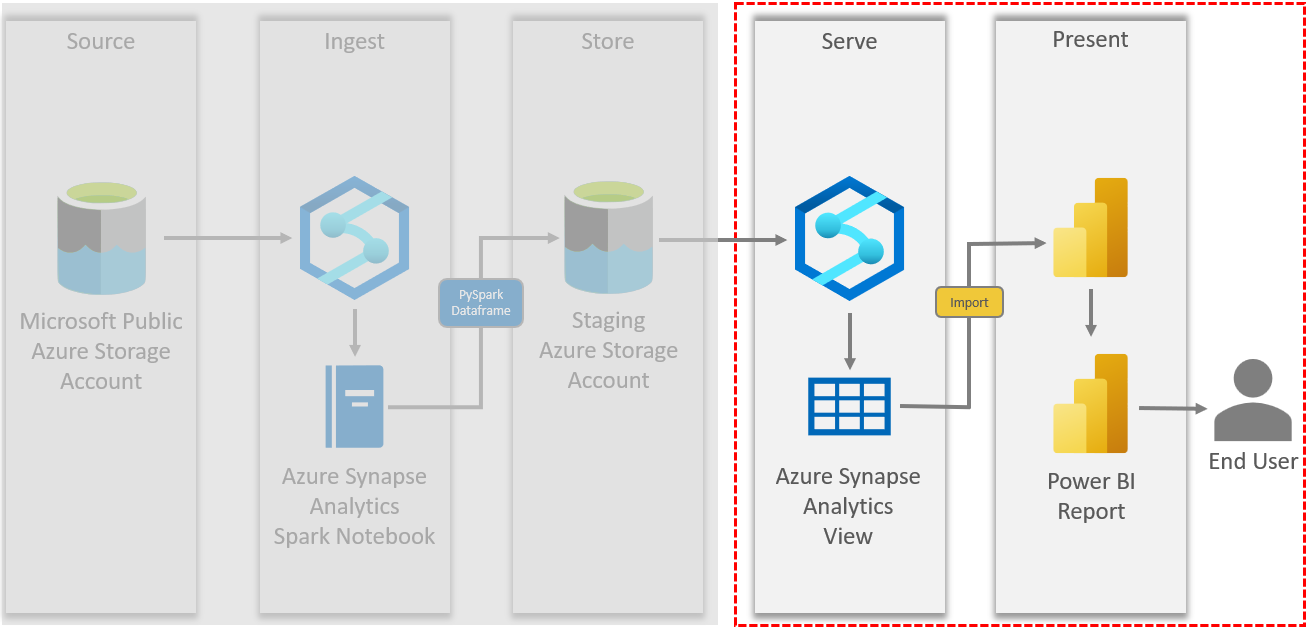
Spark notebooks in Synapse are a useful resource for data ingestion. As outlined in our solution diagram below, it uses a Spark notebook to load data from a Microsoft public Azure storage account (ADLS) into our own staging Azure storage account (ADLS).
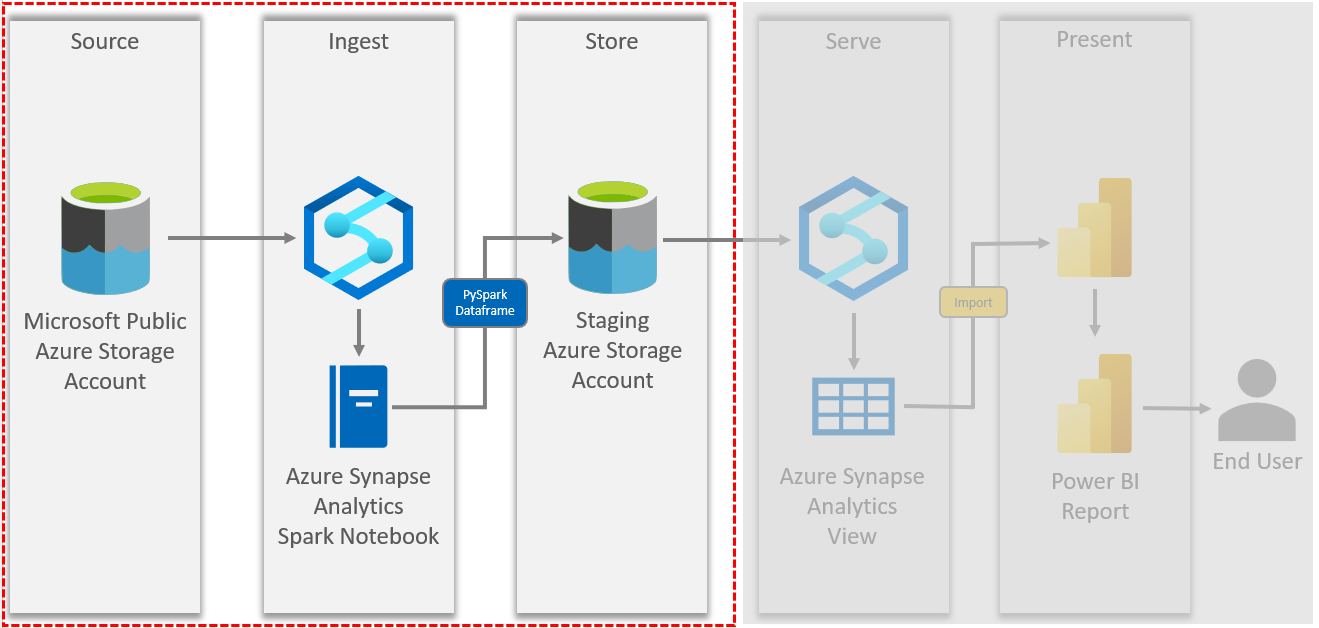
Our solution sources a public dataset provided by Microsoft on US population by zip code. This dataset is hosted in Azure blob storage and the code to access it is provided in the Microsoft documentation.
Here is our full PySpark code for data ingestion in this notebook:
|
1 2 3 4 5 6 7 8 |
# Azure storage access info - from MS dcoumentation blob_account_name = "azureopendatastorage" blob_container_name = "censusdatacontainer" blob_relative_path = "release/us_population_zip/" blob_sas_token = r"" #Staging data lake storage location - our code my_data_lake = "abfss://demo@synapse-workspace.dfs.core.windows.net/powerbi_blog" |
|
1 2 3 4 5 |
# Allow SPARK to read from Blob remotely - from MS dcoumentation wasbs_path = 'wasbs://%s@%s.blob.core.windows.net/%s' % (blob_container_name, blob_account_name, blob_relative_path) spark.conf.set( 'fs.azure.sas.%s.%s.blob.core.windows.net' % (blob_container_name, blob_account_name), blob_sas_token) |
|
1 2 3 4 5 |
#Read the dataset into a dataframe - Our code df = spark.read.parquet(wasbs_path) #Write the dataset into our data lake in delta format - Our code df.write.format("delta").mode("overwrite") \ .save(f"{my_data_lake}/us_pop_zip") |
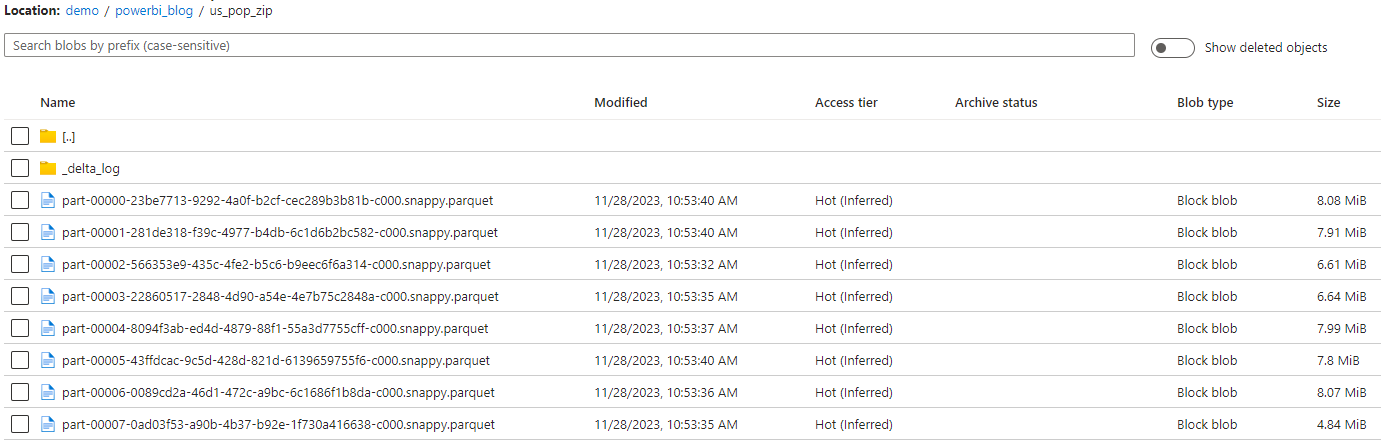
After executing this notebook, a delta table is written to our staging data lake location as shown below.
Creating a Synapse View
Now that the data is staged in our own storage account, Synapse serverless views make it easy to access this data just like in SQL Server. Views can be used to explore and ensure the quality of the ADLS data.
To create a Synapse serverless view, open the Synapse workspace and create a new SQL script. Select the database where this view should be created. This will be used later in the Power BI connection.
The view to connect to our staged data was defined as follows:
|
1 2 3 4 5 6 7 8 9 10 11 12 13 14 15 16 17 18 19 20 21 22 23 24 25 26 27 28 29 30 31 32 |
/********* CREATE DATA SOURCE *********/ IF NOT EXISTS (SELECT * FROM sys.external_data_sources WHERE name ='ds_my_data_lake') CREATE EXTERNAL DATA SOURCE ds_my_data_lake WITH ( LOCATION = N'abfss://demo@synapse-workspace.dfs.core.windows.net' ) GO /********* CREATE VIEW *********/ CREATE OR ALTER VIEW dbo.vw_us_pop_zip AS SELECT decennialTime, zipCode, population, race, sex, minAge, maxAge, year FROM OPENROWSET( BULK 'powerbi_blog/us_pop_zip', DATA_SOURCE = 'ds_my_data_lake', FORMAT = 'DELTA') WITH (decennialTime VARCHAR(10) COLLATE Latin1_General_100_BIN2_UTF8, zipCode VARCHAR(10) COLLATE Latin1_General_100_BIN2_UTF8, population INT, race VARCHAR(50) COLLATE Latin1_General_100_BIN2_UTF8, sex VARCHAR(10) COLLATE Latin1_General_100_BIN2_UTF8, minAge INT, maxAge INT, year INT) as rows; |
An external data source should be created first that points to the staged data lake container. This is then referenced in the OPENROWSET of the view to let Synapse know the location of the ADLS data. We did some data analysis to determine the appropriate data type limits for the column definitions in the WITH clause.
Pro Tip: The column definitions in the WITH clause are important because Synapse will attempt to infer the schema if the WITH clause is left out and will set the data types to non-optimal values.
Example: all varchar data types are set to VARCHAR(8000).
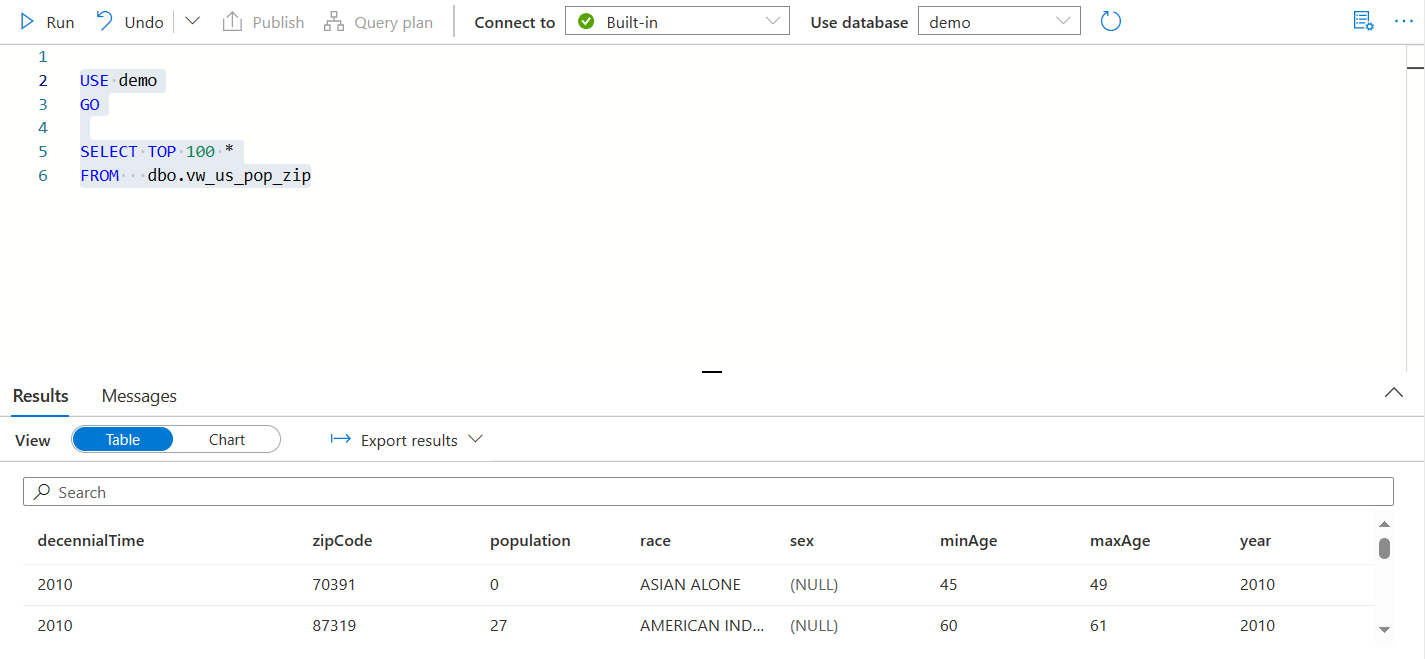
Now this view can be used to query the ADLS staged data, which can also be used in Power BI connection.
Connecting to the Synapse View Using Power BI
It is very easy to connect to the Synapse view using Power BI Desktop to create shareable reports with a wide variety of visualization options.
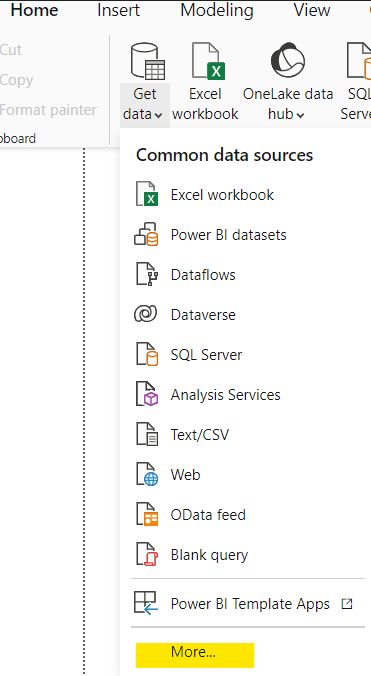
First, open Power BI Desktop and create a new report. Then select “Get Data” and “More…” from the ribbon.
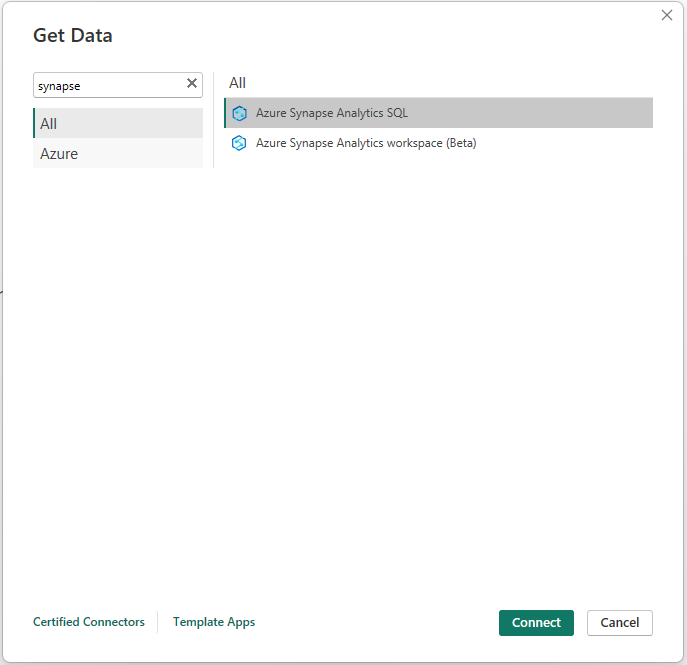
Enter “synapse” in the search box, then select “Azure Synapse Analytics SQL”.
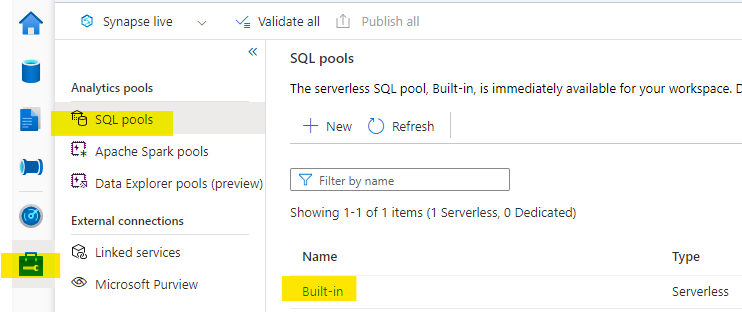
Next, determine the SQL endpoint for the Synapse workspace. To do this, click on the “Manage” tab on the left navigation of Synapse Studio. Click on “SQL Pools” and then click on the “Built-in” pool.
Now copy the value of the “Workspace SQL endpoint”.
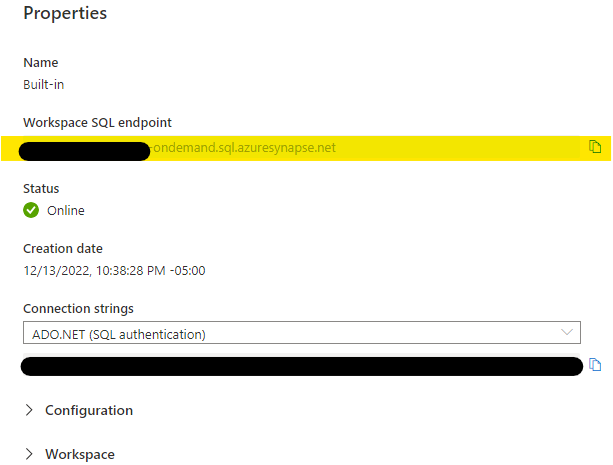
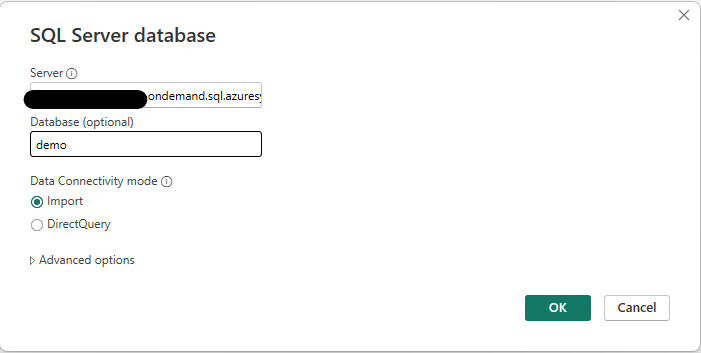
Enter the SQL endpoint into the “Server” textbox, and database name in the “Database” textbox. In most cases, leave Data Connectivity Mode set to “Import” and click OK. You will be prompted to enter the credentials for this connection.
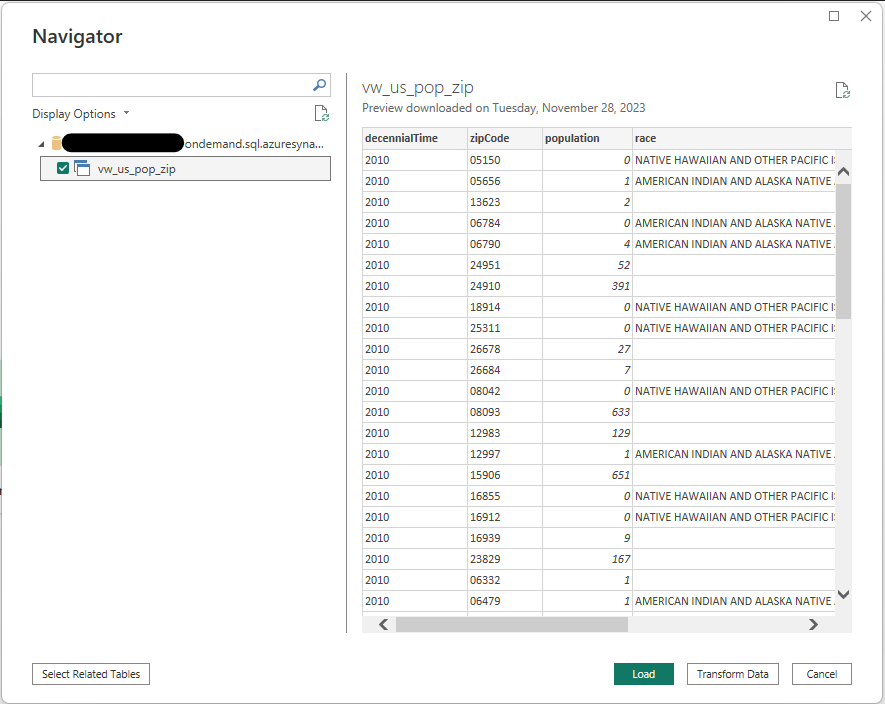
Next, a list of views will be shown that exist in the database that was entered. Choose the view(s) that you would like to use for the report, then click “Load”.
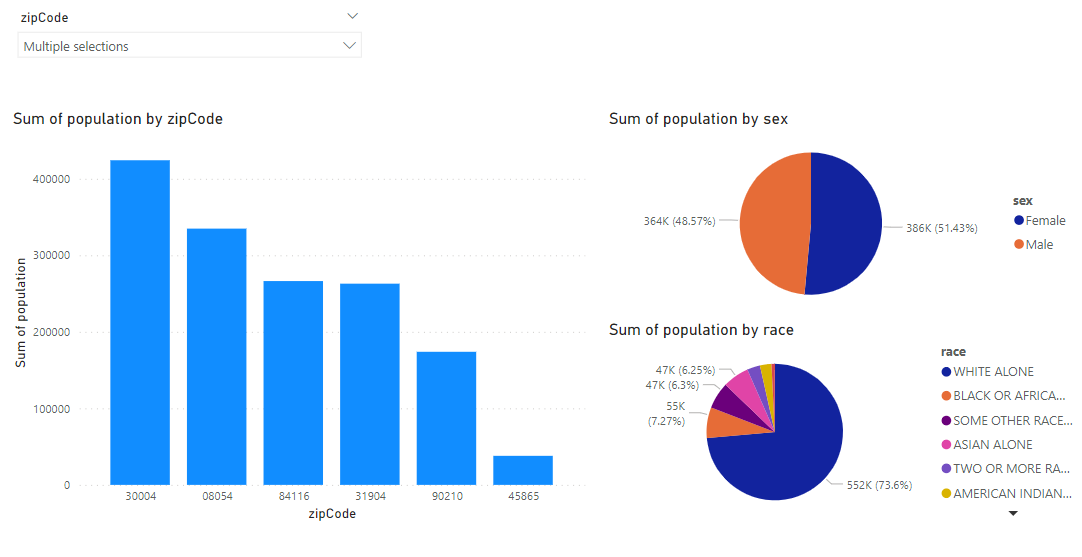
The selected views will then be loaded into Power BI Desktop. From here you can select the appropriate fields and visuals to create reports like the example below:
Thanks for Reading! Does Your Company Need Help With Power BI or Azure Synapse Analytics?
Does your company need help getting the most out of Power BI or Synapse? We’ve helped many companies maximize their investments in these technologies. Check out these two pages below for information on our consulting services:
Keep Your Data Analytics Knowledge Sharp
Get the latest Key2 content and more delivered right to your inbox!