By: Brad Lathrop
Google’s open-source web application framework, Angular, has seen tremendous success since its initial release in the fall of 2016. The platform is now the fourth most used web framework among developers globally.
Knowing this, it’s no surprise that Microsoft has just announced a Power BI Angular component. The component “lets you easily embed your Power BI reports, dashboards and more into your Angular web application” according to Microsoft’s official announcement.
This is welcomed news for Angular developers. The ability to embed Power BI assets like reports, dashboards, and visuals into web and mobile applications will only enhance developers’ abilities to create highly useful apps.

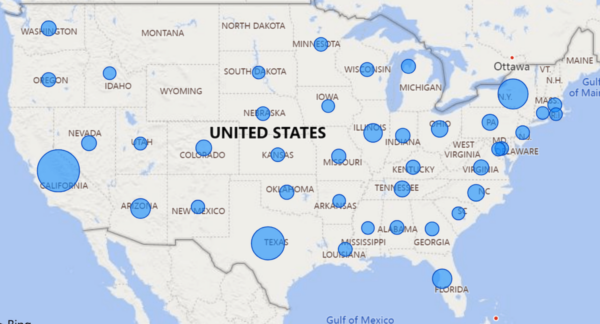
A Power BI bubble map visual
You can access the new Power BI component on Github here. It’s also available on npm.
Microsoft has also kindly done people a favor by creating a demo application to see how the new component works. You can find that demo application here.

Questions?
Thanks for reading! We hope you found this blog post useful. Feel free to let us know if you have any questions about this article by simply leaving a comment below. We will reply as quickly as we can.
Keep Your Data Analytics Knowledge Sharp
Get fresh Key2 content and more delivered right to your inbox!
About Us
Key2 Consulting is a boutique data analytics consultancy that helps business leaders make better business decisions. We are a Microsoft Gold-Certified Partner and are located in Atlanta, Georgia. Learn more here.


