")

By: Dean Jurecic
After you’ve connected to a data source and have carefully selected the right visuals, formatting, and other elements for your report and shown it to the intended users, you will often hear something like the following:
“This looks great, but I just want the data. How do I get this into Excel?”
Users asking this question may prefer to do their own analysis of the data or may have specific or ad-hoc requirements that are not part of a standard report. The good news is that Power BI can work for these users too.
For most cases, the recommended way to look at Power BI data in Excel is by using the Analyze in Excel feature, which is included in the Power BI service and recent versions of the Excel desktop app.
How to Access Analyze in Excel From the Power BI Service
From the Power BI service, there are two ways to start the Analyze in Excel function. First, from a workspace or the OneLake Data Hub, click “…” for more options and select Analyze in Excel.
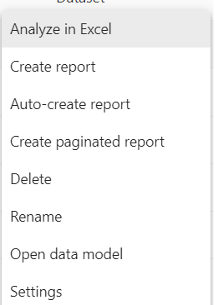
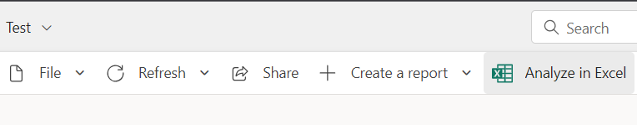
Alternately, from the dataset detail page, select Analyze in Excel from the menu bar.
After a few seconds to prepare the Excel file, you will see a message that the file is ready and a prompt to open the file in Excel for the web.

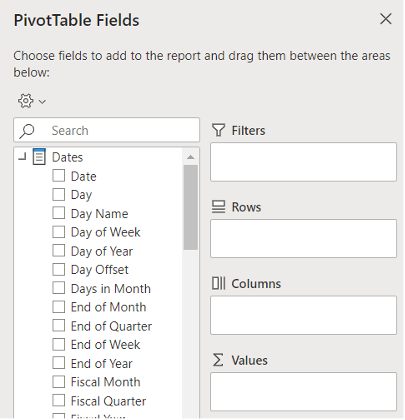
Click “Open in Excel for the web” and you will see a list of tables and fields that you can use to create a PivotTable.
From Excel Desktop
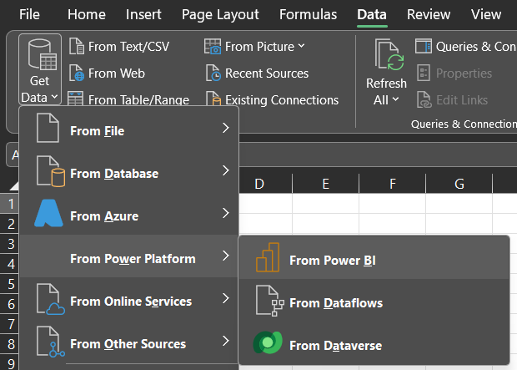
From the Excel desktop app, select “Get Data” from the ribbon. Then select “From Power Platform”, and then finally “From Power BI”.
You will be prompted to choose a Power BI dataset from a list of datasets that you have access to.
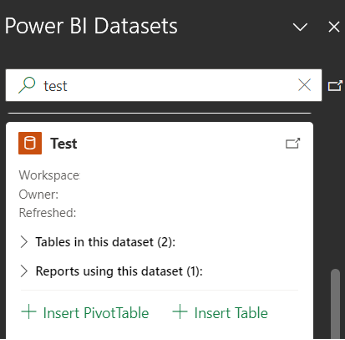
Like the web version, you will now see a list of tables and fields you can use to create a PivotTable.

Benefits of the Power BI Analyze in Excel Feature
There are several benefits in using the Analyze in Excel feature versus exporting data from an individual visual of a Power BI report:
- Analyze in Excel gives users read-only access to all fields in the Power BI dataset. Export to Excel only contains the fields shown in a single visual, not the entire dataset.
- Analyze in Excel gives users read-only access to all records in the Power BI dataset. Export to Excel has a limit of not more than 150,000 records and may be less than that depending on query complexity.
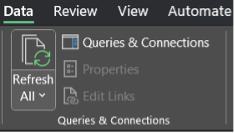
- Analyze in Excel creates a connection to a Power BI dataset and users can refresh the data using the Refresh function in Excel. Export to Excel makes a copy of the data in a visual that cannot be updated later.
Power BI Analyze in Excel Enabling & Permissions
Analyze in Excel must be enabled at the tenant level before it can be used. If the Analyze in Excel feature is missing or greyed out, check with your tenant administrator to make sure it has been enabled on your Microsoft tenant. To enable from the Power BI admin portal, go to “Tenant settings”, then “Users can work with datasets in Excel using a live connection”.

Additionally, you must have build permission on the dataset, or a role of contributor or higher, and you must have a Power BI license. For more information on Power BI licensing and pricing, check out our blog post, “Power BI Pricing – How Much Does Power BI Cost? [2023 Updated]
Does Your Company Need Help With Power BI?
Are you looking to get the most out of Power BI? We can help. Our company is a Microsoft Gold-Certified Partner and has helped companies of all sizes maximize Power BI. Learn more about our Power BI consulting services and contact us today.
Keep Your Data Analytics Knowledge Sharp
Get the latest Key2 content and more delivered right to your inbox!