
By: Ken Adams
Over the last number of years our company, Key2 Consulting, has seen a shift in our clients’ desires to move to the cloud.
We historically were a business intelligence shop that mostly architected on-premise solutions. Creating these solutions primarily involved dimensional modeling, data integration work, and reporting.
Fast forward to today and the majority of our work centers around cloud architecture – most of it in Azure.
This is a trend that’s been going on for some time. Throughout the process, we’ve noticed that some government agencies and even smaller firms have been slow or unable to adopt cloud technology.
Doing so (shifting from on-prem to the cloud) requires a change in mindset and the ramping up of team members for cloud work.
In order to better assist businesses considering a move to the cloud, we realized that our company needed something tangible to show current and potential clients – something that represented aspects of the cloud and the new architecture it entails.
We also knew that creating something tangible could provide us with a sandbox for R&D along with training for new or existing employees. It took some time for us to get it moving, but in the last six months we have embarked on the development of our very own Key2 End-to-End Azure Demo Solution.
There were a few required elements that we wanted to showcase in our solution:
- Power BI
- Azure Data Lake Services (ADLS2)
- Azure Data Factory (ADF)
- Databricks
- Delta Lake (and more recently Delta Live)
- Azure SQL and/or Synapse
- A template-based data integration framework
Some initial work started several months ago and was divvied up based on several key categories:
- Data lake design
- Data lake ingestion process
- Data refinement and curation
- Analytics model
- Ingestion process for the analytics model
- Power BI reports and dashboards
- Costing model
Resources who were interested in the different categories volunteered their time outside of their dedicated project work. We also asked the larger project team to start looking for free and interesting data sets. After a couple of laps around the track, we found a winner. The US Energy Information Administration (EIA) is the statistical arm of the US Department of Energy. It provides data, forecasts, and performs analysis to help inform policy-making.
The amount of data collected is pretty amazing and is available for free via an API call or in Excel. We narrowed our focus to electricity production and opted for Excel as our source – at least for the initial portion of the demo. In the future we’d like to interact with the API and micro-batch the data (but we first needed to vet that the data would support the desired Power BI functionality).
Here are a few of the Power BI features that we wanted to showcase:
- Power BI security and sensitivity labels
- Interoperability with Excel
- Browser and mobile support
- Publishing with deployment pipelines
- Self-service analytics (mash-up capability)
These features were incorporated in addition to ensuring that the data had a good time series, location attributes, and additive measures. The EIA electricity production data checked all of these boxes and then some.
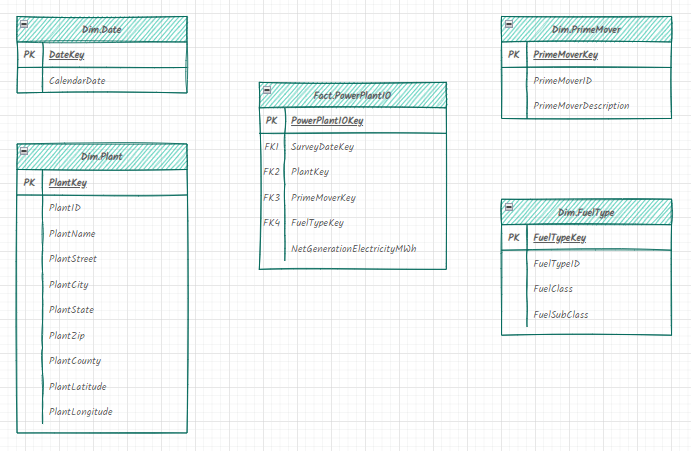
The next step was to formulate a dimensional model. A group of us spent time reviewing the data and looking for natural filters. Fortunately these broke down pretty naturally around the date, fuel type, plant, etc. The primary measure of the solution is energy production and the grain of the measure group is date and plant.
Here is a simple view of the dimensional model:
Where Does Our Azure Solution Stand Today?
At the time of this writing, we have provisioned a stack in Azure with the required technologies from above. In addition to what is listed there, we stood up a virtual machine for the team to perform development tasks. Rather than wait until Azure Data Factory (ADF) pipelines and associated Databricks notebooks could be created, we did some crude imports of the data into Azure SQL. The dimensional model was created and imports were done using a combination of SSIS and T-SQL scripts.
The dimensions were loaded along with eight year’s worth of historical energy production data. This allowed our Power BI team to begin data exploration and confirm that the required functionality could be shown using the energy production data. This was confirmed and we are off and running.
So now what? Our Power BI team is continuing to work on the reports using the data that was loaded. Our data integration team will now take that crude logic and translate it into a combination of data munging scripts written in Python and SQL. Initially, the data will be pulled from the Excel files with the ultimate goal of having ADF connect directly to the EIA API and perform the data extraction incrementally.
The Excel files will be landed as Parquet files in ADLS and subsequently, Databricks will progress the data through to Azure SQL. At this time, we aren’t going to use Synapse but will at some point down the road.
The team has worked hard to get to this point. All of us are fully engaged with client work and some of us are working with multiple clients. Finding time to keep things moving forward is not easy but the progress has been good. We plan to update this series as we go and will touch on various aspects of the project. Thanks for reading.
Thanks for Reading! Questions?
Thanks for reading! We hope you found this blog post useful. Feel free to let us know if you have any questions about this article by simply leaving a comment below. We will reply as quickly as we can.
Keep Your Data Analytics Knowledge Sharp
Get fresh Key2 content and more delivered right to your inbox!
About Us
Key2 Consulting is a boutique data analytics consultancy that helps business leaders make better business decisions. We are a Microsoft Gold-Certified Partner and are located in Atlanta, Georgia. Learn more here.